Know what’s built before you release the money.
Live risk monitoring for development lenders, from the site up. Every source is verified where it’s captured, so nothing reaches you that the borrower can edit.
- Site photosAI vision · GPS · timed
- InvoicesHMRC · Companies House
- Bank accountOpen banking · read only
- ChargesPublic register
- MarketTracked weekly
- Live progress
- Completion forecast
- Cost to complete
- Covenant alerts
- Drawdown sign-off
- Portfolio view
- Audit trail
Trace any pound back to the site.
Pick a line from the drawdown. Each one leads to its photo, its invoice and its bank payment.
Your surveyor checks the list and approves online. They still decide, and still visit whenever they choose.
- 15 Sep, 14:32
Verified photo
Taken in the app camera, inside the site boundary. The AI reads studwork in, not boarded: 40%.
Verified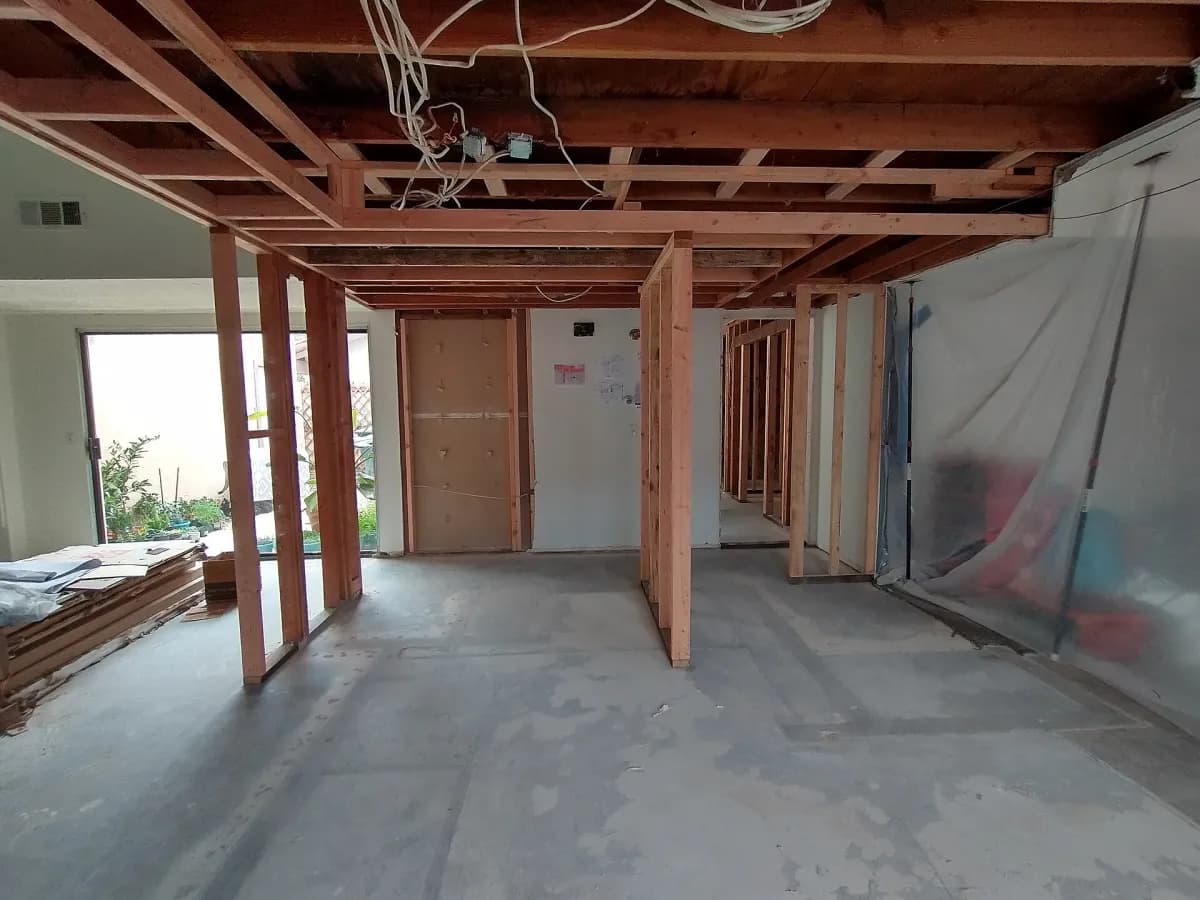
- 15 Sep, 14:40
Invoice 0042, Brightline Interiors
On Companies House, VAT number valid with HMRC, no duplicate on any project, lines within the agreed rates. It claims 70% of the job.
Held: the photos show 40% - 23 Sep, 09:12
New verified photo
The same room, boarded. The AI reads 70%, so the claim now matches the evidence.
Cleared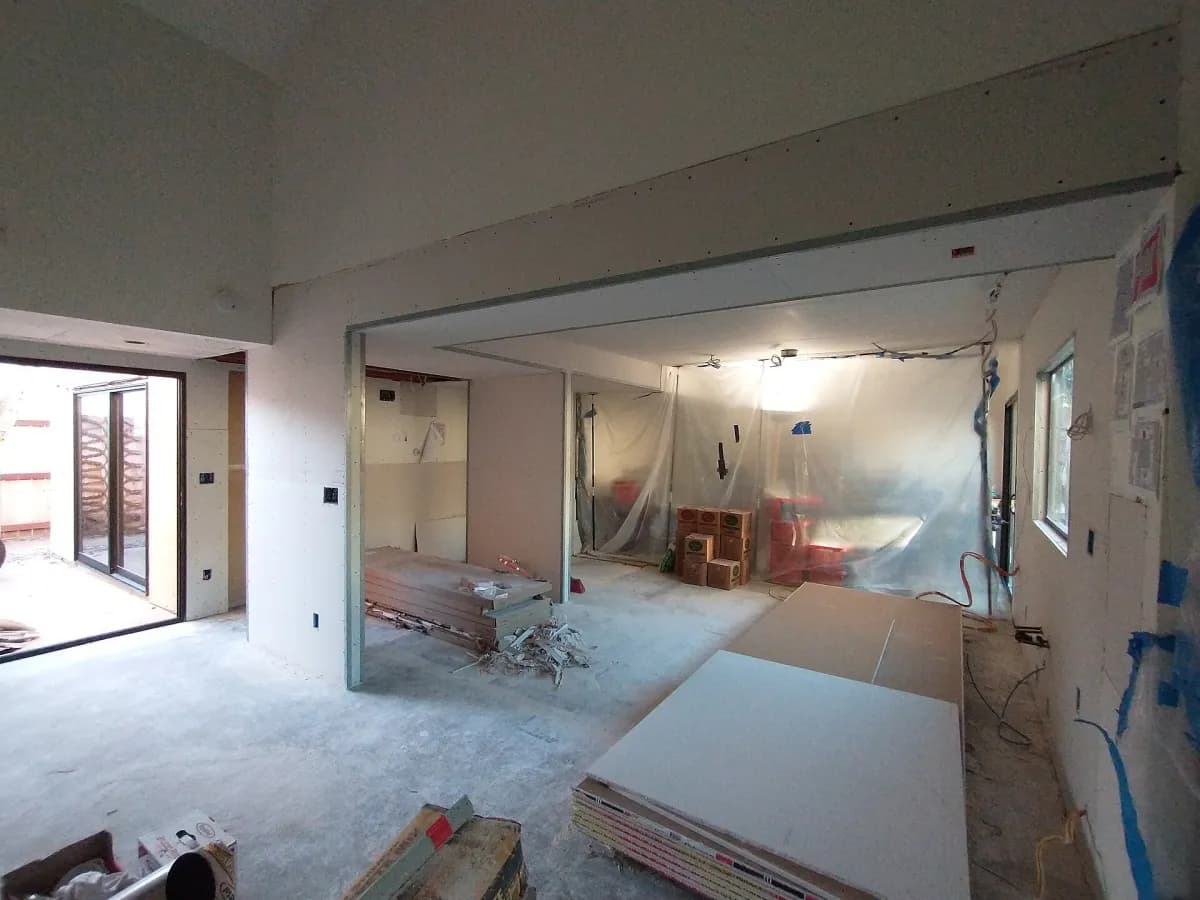
- 24 Sep, 11:05
Payment of £18,400
Read through open banking from the borrower's account ending 4821. Matched to invoice 0042, paid in full.
Matched
Demo estate, simulated data.
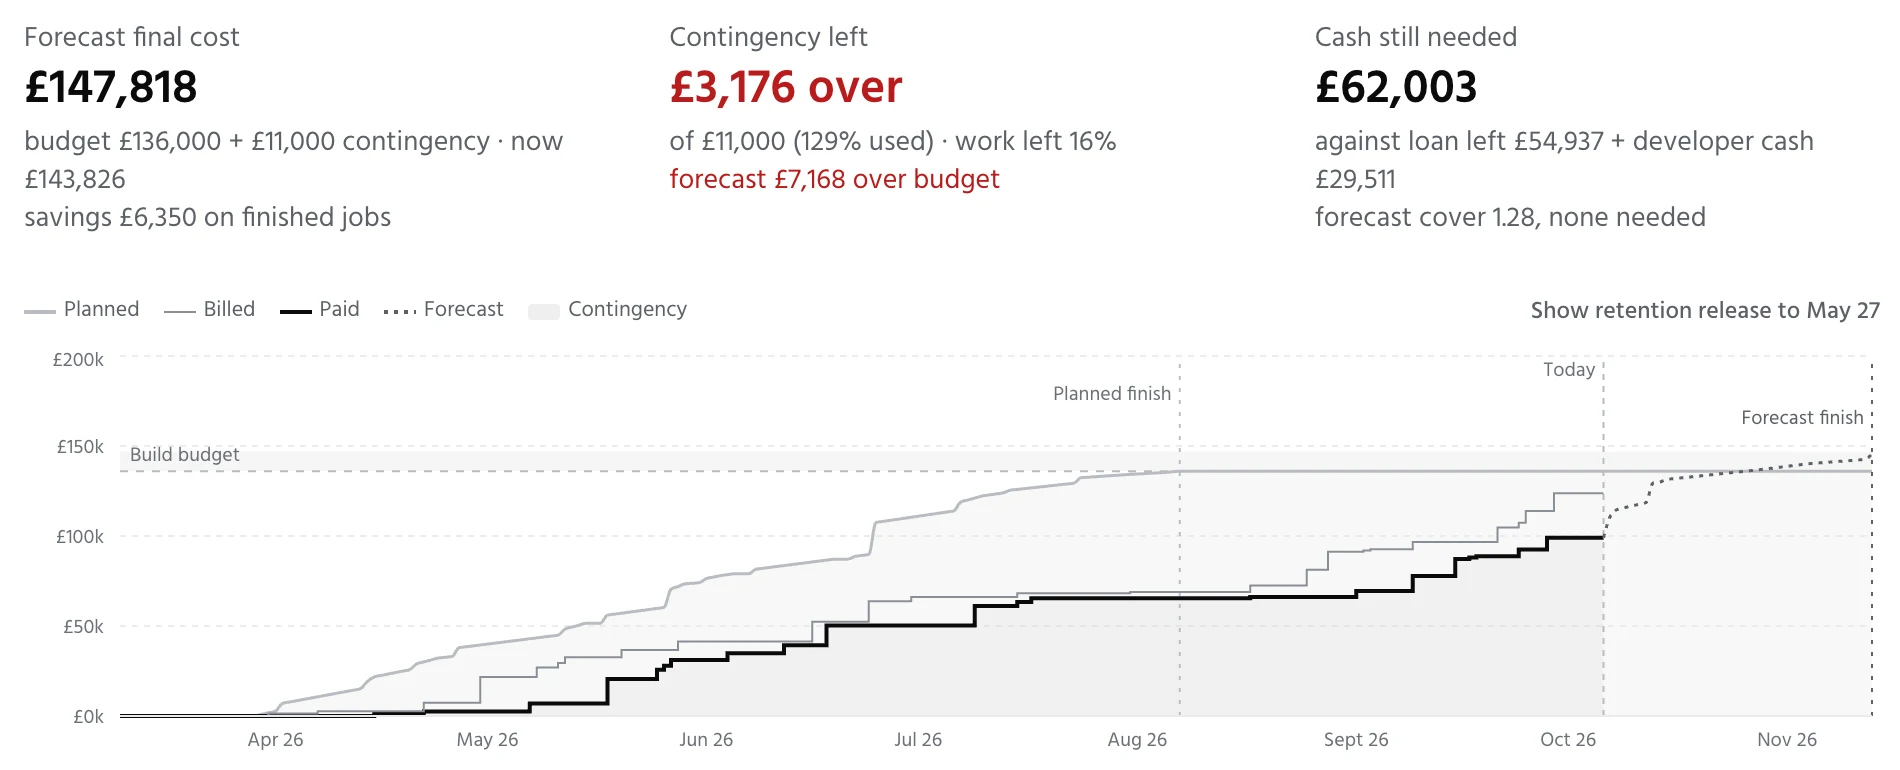
A live forecast, moved by the site.
Every verified photo, invoice and payment moves the forecast. You see cost and completion change as the project moves, not at the next visit.
Cost to complete
Completion against loan expiry
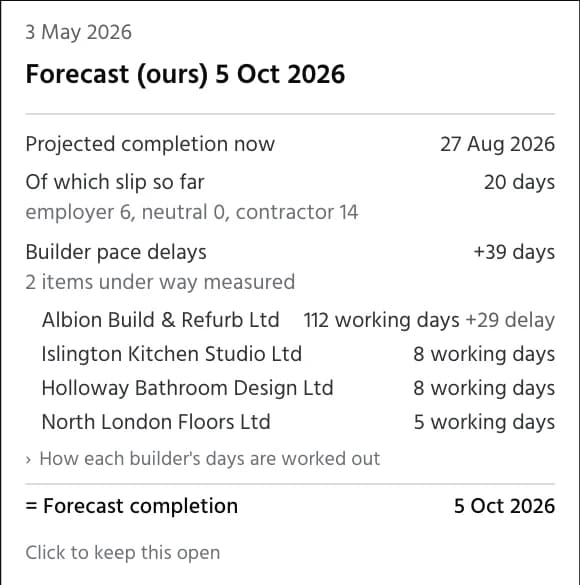
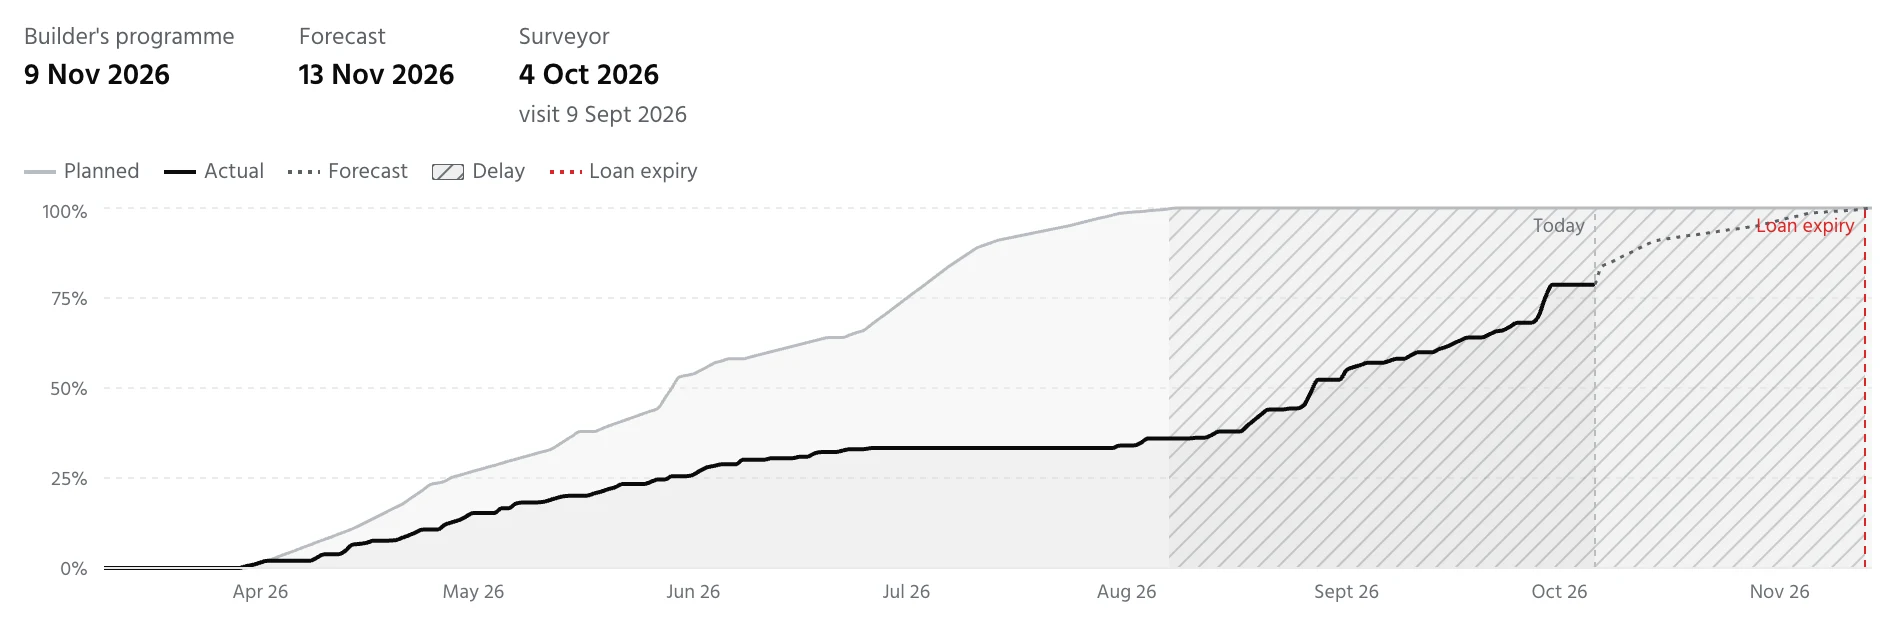
Demo estate, simulated data.
Request a walkthrough.
We’ll walk you through the workflow, share the live demo estate and answer the questions you have.